
Railway infrastructure
I know where the data comes from because I worked next to the track: catenary and measurement systems, work management, asset and network data, GIS — and the organisation that has to keep it all correct.
MatData helps infrastructure managers and railway undertakings turn scattered asset, network and operational data into connected, standards-based knowledge — from data strategy to systems in production.
Expertise
Most data consultants know data. Most railway engineers know the railway. MatData works where the two meet — so the model fits the infrastructure, and the infrastructure data fits the model.
I know where the data comes from because I worked next to the track: catenary and measurement systems, work management, asset and network data, GIS — and the organisation that has to keep it all correct.
Ontologies and knowledge graphs that other organisations can reuse: the ERA ontology and RINF, railML, SHACL validation and SPARQL — one identifier per thing, so every system talks about the same station.
Services
A data strategy and target architecture that fit how a railway actually runs — application landscape, ownership, portfolio.
Semantic models aligned with the ERA ontology and railML, published as reusable, validated knowledge graphs.
Pipelines, data migrations and data-quality checks, built and run with DevOps practices until they are boring.
Hands-on Linked Data courses and modelling workshops so your own team can carry the work forward.
Projects
Open-source tools for railway data and Linked Data. Both run live, so you can try them right now.
See all my repositories on GitHub →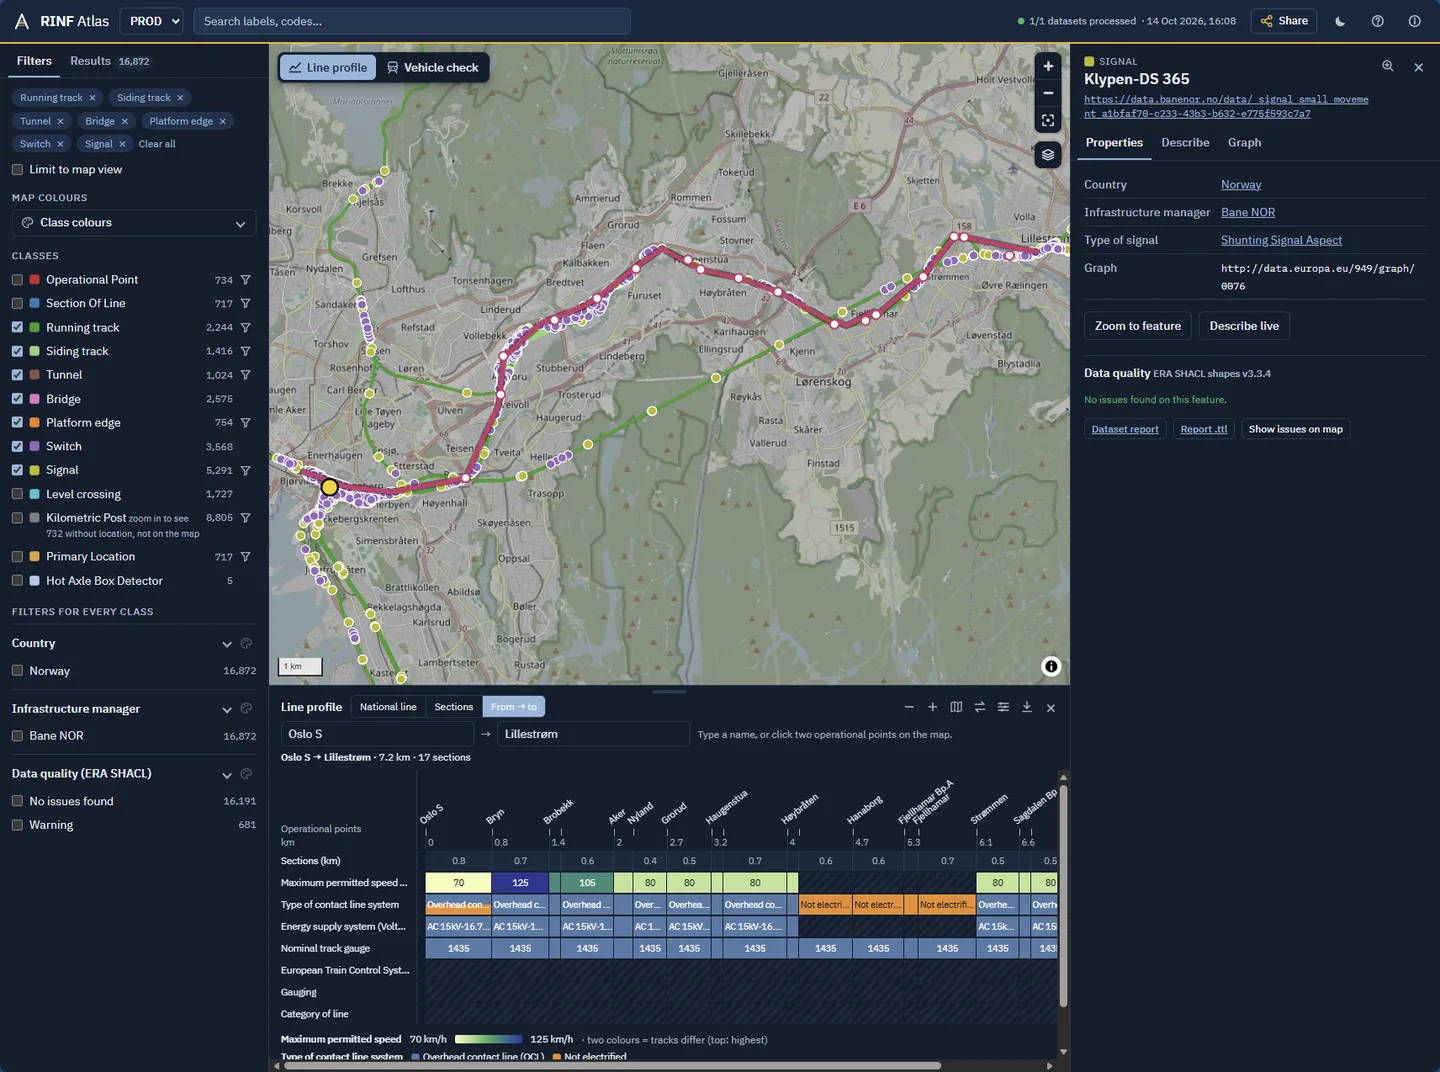
A fast map and faceted search over ERA's Register of Infrastructure: operational points, sections of line, tracks, tunnels, platforms and more, with production and test data side by side. Line profiles lay a route out as a strip with speed, electrification, gauge and ETCS level.
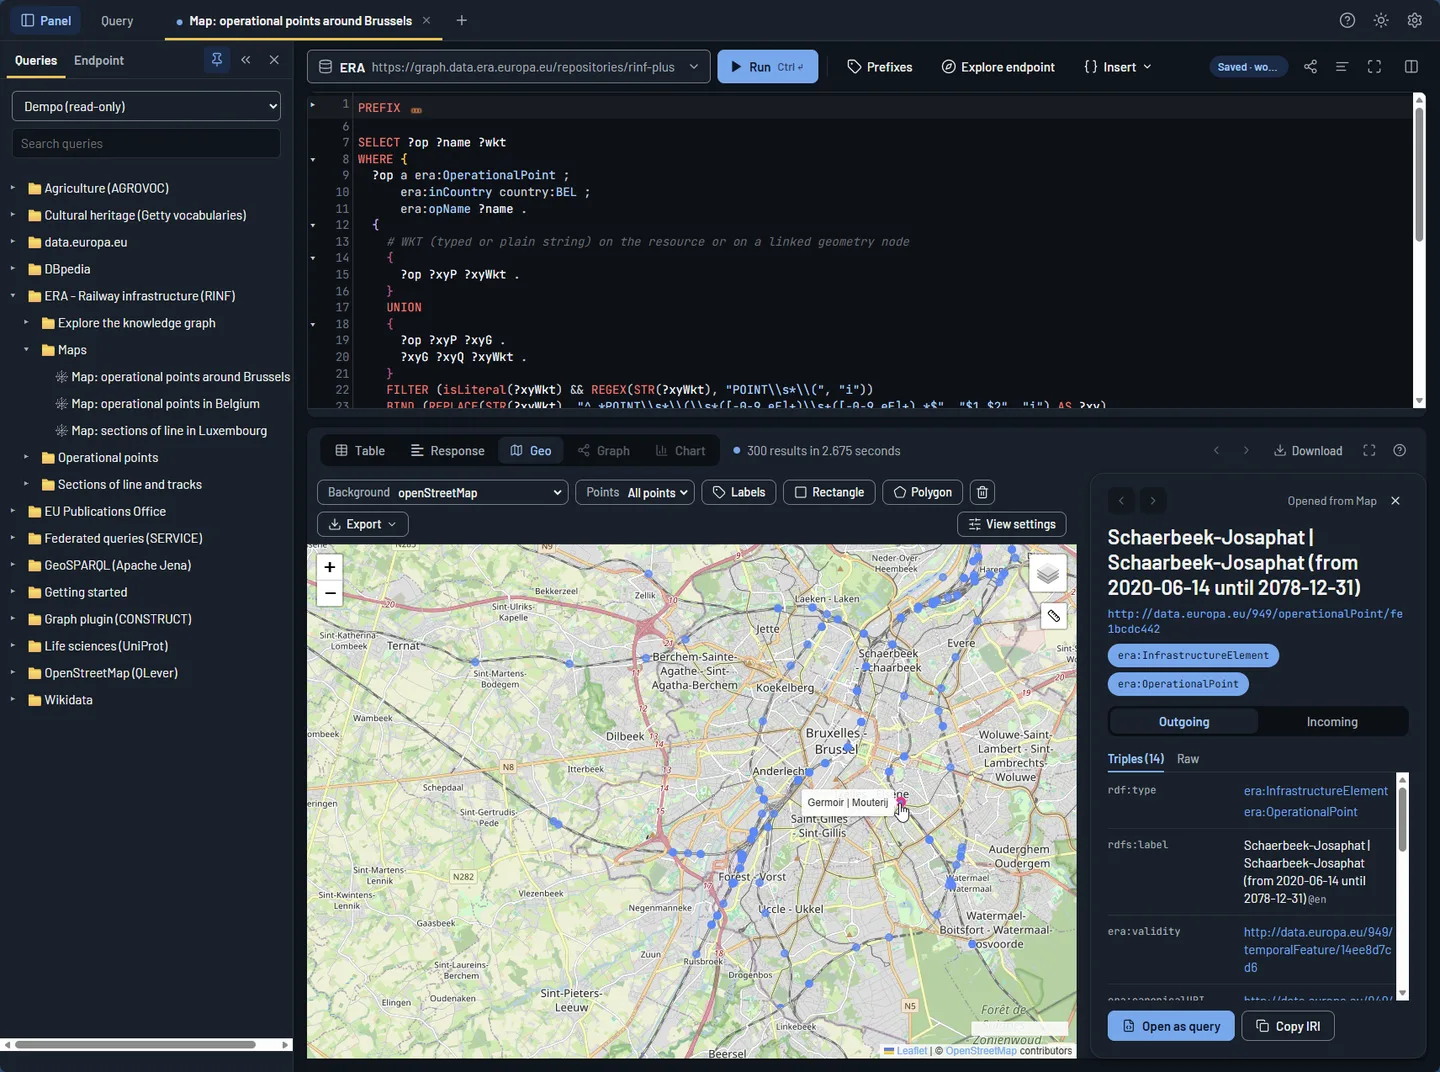
A modern knowledge graph and SPARQL workbench: a full query editor with table, graph and map views of the results. It started as a fork of Yasgui and has grown well beyond it; available as a website, on npm and on Docker Hub.
Linked Data, in railway terms
One small station, seen as a topology, as a knowledge graph, on a schematic and on a map, then aggregated to meso and macro level. Nothing is re-entered: every view comes from the same net elements and relations.
Timetables, infrastructure registers and maintenance systems each keep their own copy of a station. Give the operational point one identifier and a shared meaning, and every system points at the same place.
Track record
Two master's degrees in engineering, both magna cum laude: Energy at KU Leuven, Electromechanics at GroepT Leuven.
Download CV (PDF)Independent railway data and Linked Data consultancy. Building the Digital Infrastructure Model (DIM) for Bane NOR, independent expert in RINF and telematics for the European Union Agency for Railways (ERA), and energy expert for Certifer.
Data migration, application landscape, data quality and portfolio management.
Set up the PMO and its reporting.
Measurement systems and work management; CEN/CENELEC and EIM/ERA working groups.
Talks & papers
Most of my slides are interactive and open: click through them in your browser.
Speaker · the knowledge graph and graph AI conference, London
Speaker page →Tutorial at ISWC 2026, Bari · turning CSV, JSON, XML and more into knowledge graphs with SPARQL Anything
Tutorial page →Paper · Sem4Tra 2026 at SEMANTiCS, Ghent · lessons learned from SPARQL Anything, GeoSPARQL, SHACL and RINF publication
Slides →Hands-on workshop at the European Union Agency for Railways, for infrastructure managers and national registration entities
Slides →ICT for Railways, 8th edition, Madrid
OpenRail Day, Paris · an open-source library for railway GNSS post-processing and train path calculation
Classroom course on the TAF and TAP TSIs and their data exchange · the course material is open
Course material →Workshop at the ERA Rail Data Forum 2025, Cluj-Napoca · data modelling and ontology engineering with the ERA ontology, run twice
ERA Rail Data Forum 2025 agenda →Semantics driving FAIR data in Railways
ERA Railway Data Forum 2024 agenda →Complex subjects, explained clearly. These interactive decks walk through hard railway data questions step by step; click through them in your browser.
How the TAF/TAP TSI schemas became the telematics part of ERA ontology v4.0. For the RNE Ontology Task Force (27 Oct 2026), on behalf of Bane NOR.
Railway topology as the foundation for RINF. ERA RINF workshop, on behalf of Bane NOR.
Operational points, primary locations and sections of line on a mesoscopic topology. On behalf of Bane NOR.
Linear positioning systems, anchors, and absolute, relative, intrinsic and geometric positions on one topology, in RailTopoModel and railML 3 terms. On behalf of Bane NOR.








About
Today I build the Digital Infrastructure Model for Bane NOR, Norway's knowledge graph of its railway infrastructure, advise the European Union Agency for Railways as an independent expert in RINF and telematics, and work as an energy expert for Certifer. Before MatData I spent sixteen years on Infrabel's infrastructure data, from catenary measurements and European working groups to leading the data-centricity team. I bring that experience to railway organisations that want their data to connect, inside the company and across borders.
Based between Brussels and Leuven, working across Europe.
Contact
Tell me what you're working on. A first conversation is always free.